Business Analytics Module
The answers leadership keeps asking, without the manual pull.
Headcount by department. Turnover compared to last year. Whether pay is fair across roles. These questions come up regularly, and the answer is usually "I'll get back to you on that" while HR pulls data from multiple modules into a spreadsheet. Worksy Business Analytics brings live data from across the platform into one view, so the answers are there when the questions are.
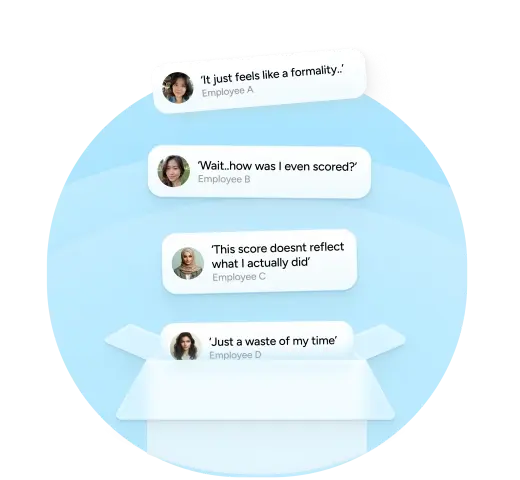
The data exists. Getting to it is the problem.
Every module in an HR system holds useful data. Payroll knows what people cost. Leave knows who's absent. Attendance knows who's working when. But when leadership asks a question that cuts across all of them, someone in HR has to pull each piece, put them together in a spreadsheet, and present a picture that's already a few days old by the time it's ready.
By the time HR sees it, it's already reactive.
Patterns that should be visible, like rising turnover in one department, absenteeism clustering around certain periods, or pay gaps widening across roles, only get noticed when someone thinks to look. HR spends its time assembling reports instead of acting on what the reports show.
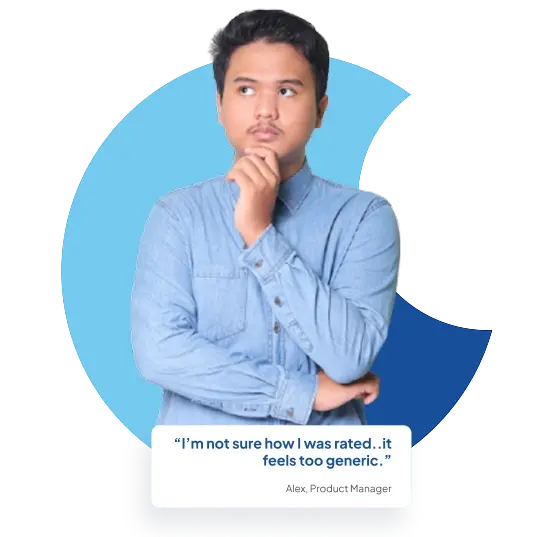
Meet Worksy’s Business Analytics Features
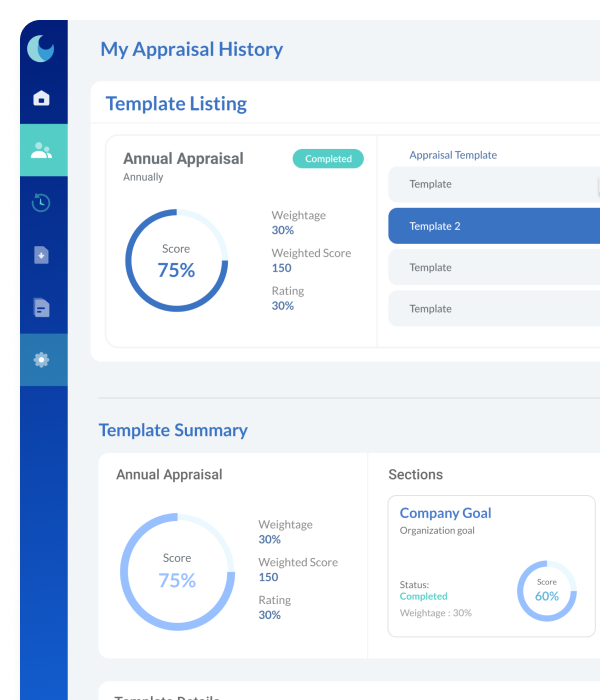
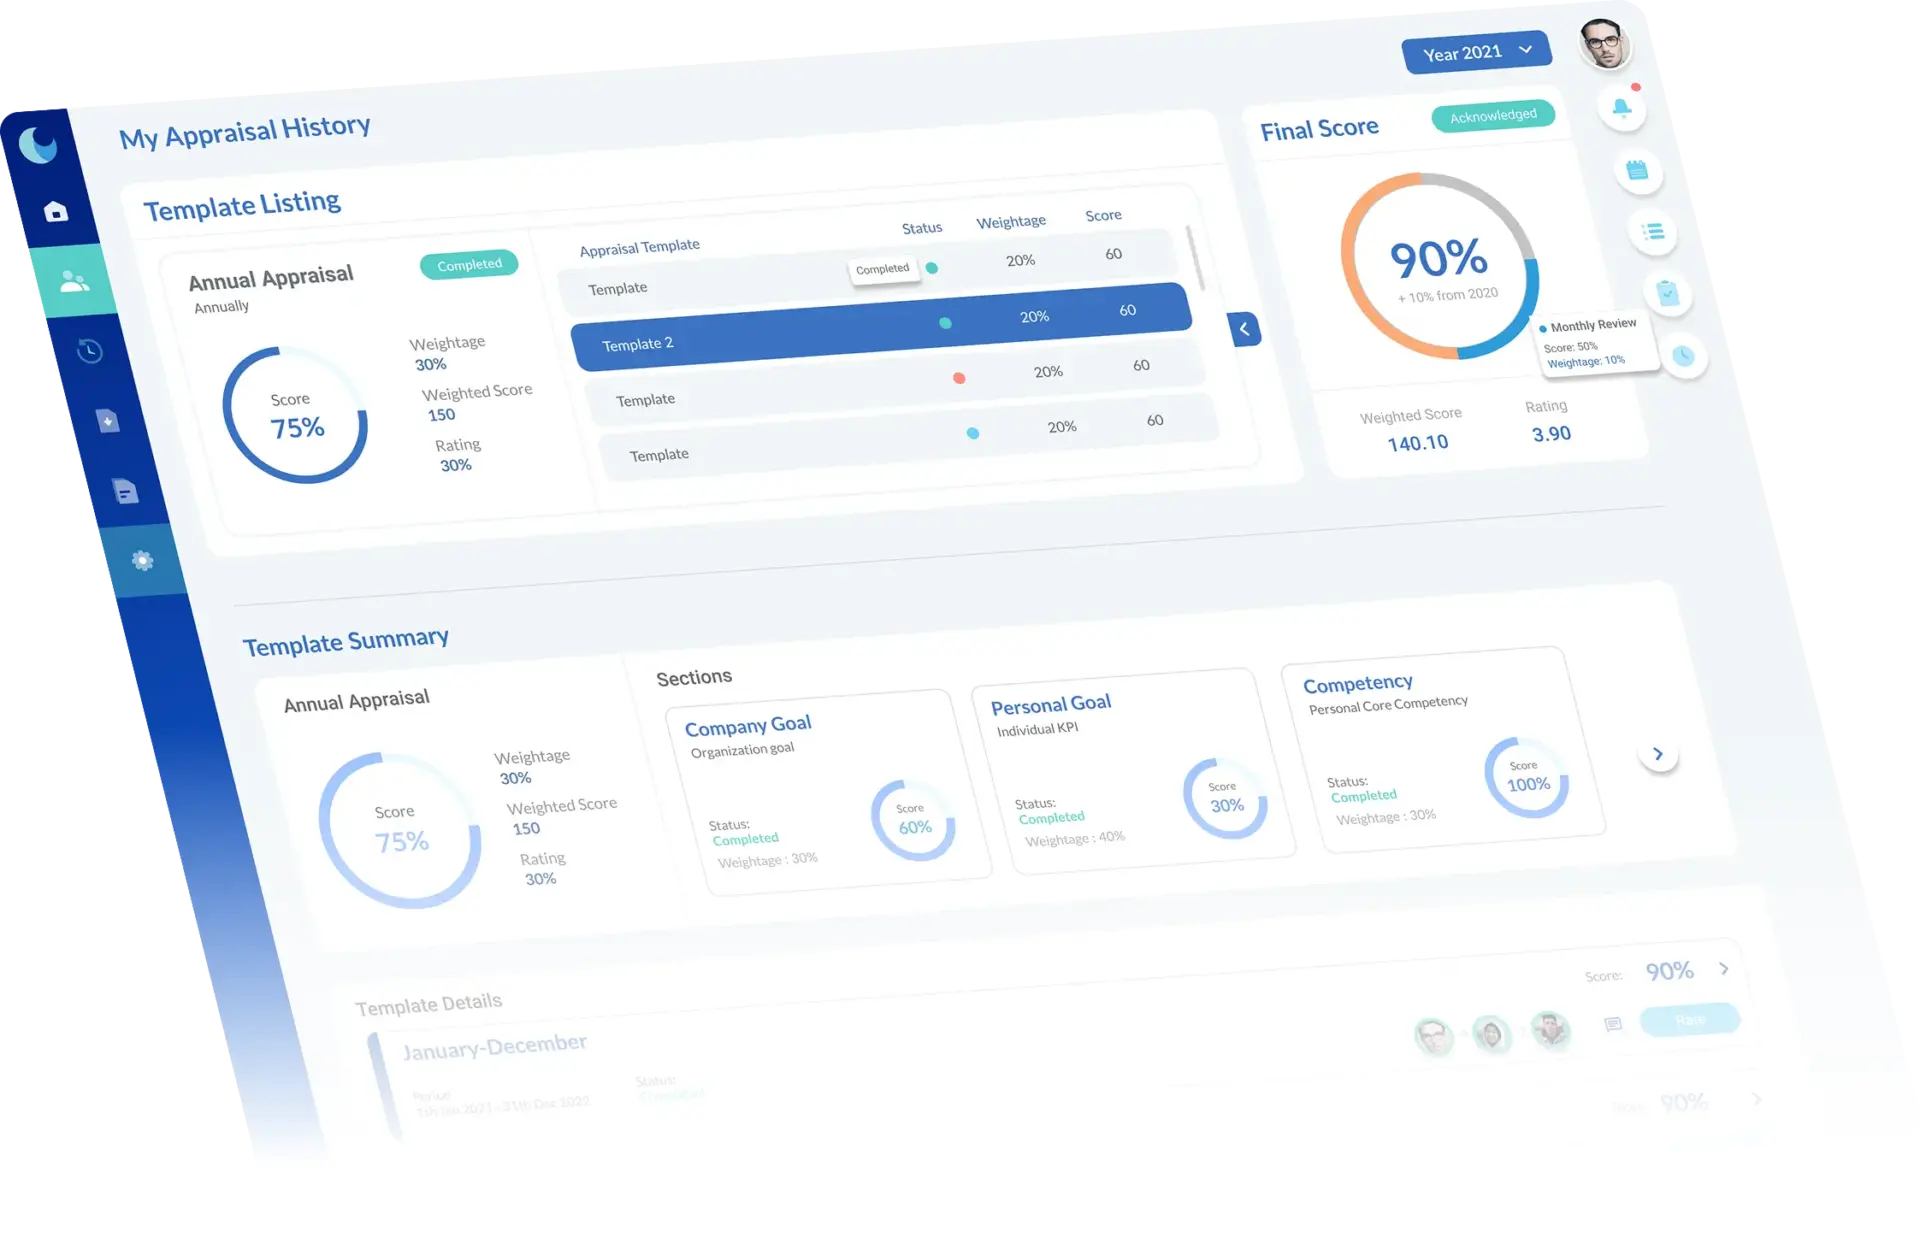
Live dashboards that pull from every module, so the numbers are ready before the question is asked.

Live Dashboards Across Modules
See data from payroll, leave, claims, attendance, and organisation performance in one view. No exporting, no assembling, no waiting.
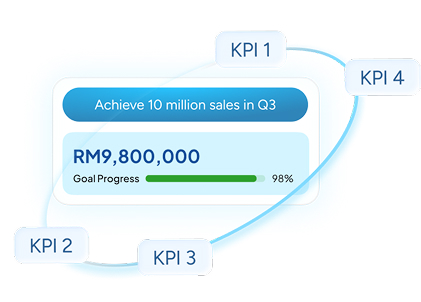
Point-in-Time Organisation View
See the organisation at any chosen date: headcount, salaries, turnover, and performance. Compare today against last quarter, last year, or any point you choose.
Operational Trends
Track age distribution, tenure, department size, and absentee patterns over time. Patterns surface from the data instead of from anecdote.
Advanced Filtering
Filter any dashboard by entity, department, location, or job role. Drill into the segment that matters without rebuilding the report.
Mobile KPI Dashboards
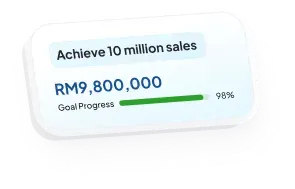
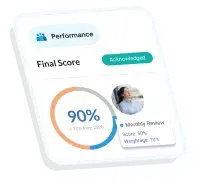
Key metrics and team performance views accessible on mobile. Leadership checks the numbers from wherever they are.
Automatic Alerts
The system flags high-risk employee patterns as they develop. Problem areas surface early, before they spread across a team or department.
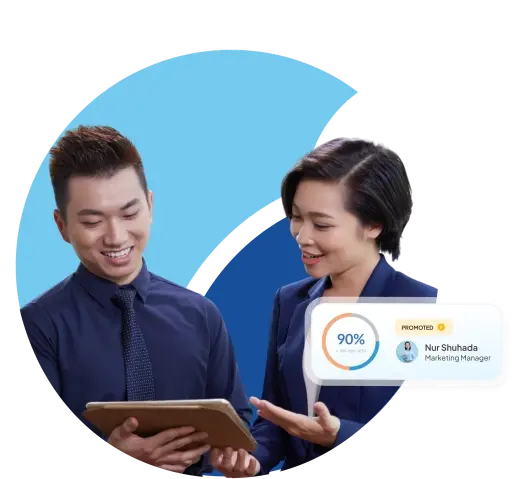
Answers that don't start with "I'll get back to you."
- Headcount, turnover, and pay data are live, not assembled on request
- Problem areas surface through alerts, not through someone remembering to check
- HR shifts from building reports to acting on what the reports show
Experience Worksy’s Business Analytics Workflow
From raw module data to live dashboards, without a spreadsheet in between.
HR teams across Malaysia already work this way.

"The Worksy team always find ways to match our needs and solve the problems we face. I really appreciate the Worksy team for making the change of HR system to our company a success and i would recommencd it to anyone that is considering to implement a complete HR system."
Jasmin Chuah
HR Department | Apex Ceramic Gallery Sdn. Bhd.

"The Worksy team always find ways to match our needs and solve the problems we face. I really appreciate the Worksy team for making the change of HR system to our company a success and i would recommencd it to anyone that is considering to implement a complete HR system."
Nurzurianeka Binti Razak (Assisstant Manager)
Blessing PU Engineering Sdn. Bhd.

"Throughout the project, Lightman team have shown professionalism and the system provided able to meet our expectation. Just tell them your company policy and they will try their best to build this system according to your policy. I am very happy to find this system."
Nuraini Binti Abu Hassan
HR & Admin Executive | Chenang Clinic

"Throughout the project, Lightman team especially Siew Ling have shown professionalism and the system provided able to meet our expectation."
Norhayati Binti Basir
Sr HR & Admin Executive | Ferco Seating Systems (M) Sdn. Bhd.

"Throughout the project, Anis and team have shown professionalism and the system provided able to meet our expectation. She is helpful and always provide guidance and solution to us.We would recommend Lightman Consulting to any company that is looking for system that can enhance their HR processes."
Lim Hong Seng
Managing Director | GL Bosum Diamond Tools (M) Sdn. Bhd.

"We thoroughly appreciated the professionalism and the support system shown by the team members from Lightman. We definitely recommend HCM to all companies, small and big. The value and benefits truly worth it."
Vanessa Chong
HR Manager | Jayagas Petroleum Products Sdn. Bhd.

"Throughout the project, Lightman team have shown professionalism and the system provided able to meet our expectation as what we required."
Izureen Aina Binti Sharilanuar
Admin Cum HR| Niase Sdn. Bhd.

"We felt the HCM solution has changed the way our company approaches our daily HR processes, in a positive & impactful manner, and we feel hopeful for our future collaboration."
Joanna Tan Tshing Tshing
Group Human Resource Manager| Perpetual Memorial Park Berhad
"Worksy can solve half the amount of my manual method in term of payroll, which reduced my workload and time.
We are truly grateful by the level of commitment delivered by your team. It has been an honor to be associated with Lightman."
Carson Loh
HR Department | BV Ventures Management Sdn. Bhd.
Frequently Asked Questions
- Does this require manual input from HR?
No. Data is automatically pulled from relevant Worksy modules, reducing manual entry and human error.
- Can we filter data by company, branch, or team?
Yes. Dashboards and reports can be filtered by entity, branch, department, or team for targeted analysis.
- Can this replace our existing HR reporting process?
In most cases, yes. Business Analytics centralises HR data into real-time dashboards, removing the need for manual reports and spreadsheets.
- Is this data live or delayed?
Data is updated in near real-time, reflecting the latest available information across the system.
- Can executives access dashboards directly?
Yes. Executives can be granted direct, role-based access to dashboards without needing HR as a middleman.